
函式簡介
函式功能
subplot是MATLAB中的函式。
使用方法:subplot(m,n,p)或者subplot(m n p)。
subplot是將多個圖畫到一個平面上的工具。其中,m表示是圖排成m行,n表示圖排成n列,也就是整個figure中有n個圖是排成一行的,一共m行,如果m=2就是表示2行圖。p表示圖所在的位置,p=1表示從左到右從上到下的第一個位置。
在matlab的命令視窗中輸入doc subplot或者help subplot即可獲得該函式的幫助信息。
簡單的例子
把繪圖視窗分成兩行兩列四塊區域,然後在每個區域分別作圖,基本步驟:
subplot(2,2,1); % 2、2、1之間沒有逗號也可以
在第一塊繪圖
subplot(2,2,2);
在第二塊繪圖
subplot(2,2,3);
在第三塊繪圖
subplot(2,2,4);
在第四塊繪圖
示例
示例1:
%在MATLAB的命令視窗依次輸入以下命令:(>>不用輸入)
>> t=0:0.001:1;
>> y1=sin(10*t);
>> y2=sin(15*t);
>> subplot(2,1,1)
>> plot(t,y1)
>> subplot(2,1,2)
>> plot(t,y2)
%運行結果見右圖。也可以將上述命令寫成一個程式段:
function subplot_sample1()
close all
figure
grid on
t=0:0.001:1;
y1=sin(10*t);
y2=sin(15*t);
subplot(2,1,1)
plot(t,y1)
subplot(2,1,2)
plot(t,y2)
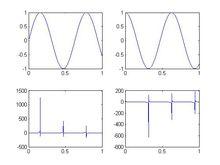
示例2:
function subplot_sample1()
close all
figure
grid on
t=0:0.001:1;
subplot(2,2,1)
plot(t,sin(10*t))
subplot(2,2,2)
plot(t,cos(10*t))
subplot(2,2,3)
plot(t,tan(10*t))
subplot(2,2,4)
plot(t,cot(10*t))
 subplot
示例3:
x1=[1 2 3];
x2=x1;
x3=x2;
x4=x1;
y1=[2 4 6];
y2=2*y1;
y3=3*y1;
y4=4*y1;
subplot(2,2,1)
plot(x1,y1);
axis([0,20,0,20])
subplot(2,2,2)
plot(x2,y2);
axis([0,20,0,20])
subplot(2,2,3)
plot(x3,y3)
axis([0,20,0,20])
subplot(2,2,4)
plot(x4,y4)
axis([0,20,0,20])
示例3
%畫上二下一的圖
subplot(2,2,1);
。。。。。
subplot(2,2,2);
。。。。。。
subplot(2,2,3:4)
